Authorized Reseller — Golden Software
Surfer® 2D/3D Modeling
Trusted by over 100,000 scientists and engineers worldwide, Surfer simplifies transforming complex geospatial datasets into accurate 2D and 3D models.
Trusted by over 100,000 scientists and engineers worldwide, Surfer simplifies transforming complex geospatial datasets into accurate 2D and 3D models.
Stakeholders rely on you to provide insights that save time, money, and headaches. With Surfer’s robust suite of analysis features, you’re equipped to deliver exactly that. Your expertise combined with Surfer’s arsenal of analysis tools makes a powerful combination to develop meaningful interpretations.
Adjust interpolation and gridding parameters to ensure accuracy and increase confidence in the interpolated dataset. Include variogram models, define faults and breaklines, or generate grid statistics to identify trends or anomalies.
Transform regularly or irregularly spaced data onto a grid or raster with 13 different interpolation methods including Kriging, Inverse Distance to a Power, and Triangulation with Linear Interpolation.
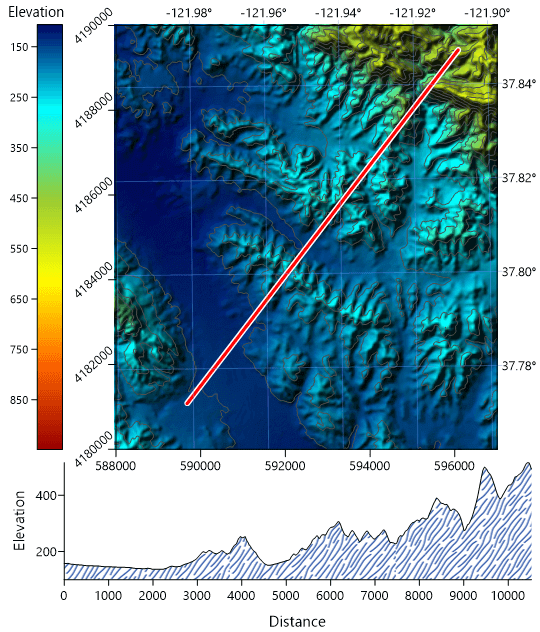
Bring subsurface characteristics to light with cross sections or profile maps or explore the data from every angle in Surfer’s 3D view as you fly between drillhole paths and inspect all aspects of isosurfaces and volumes.
Apply mathematical operations on grid files, including “matrix math” operations. Generate isopach or isochore maps, calculate contamination volumes, identify anomalies, model groundwater flow and solute transports, or calculate slope and aspect.
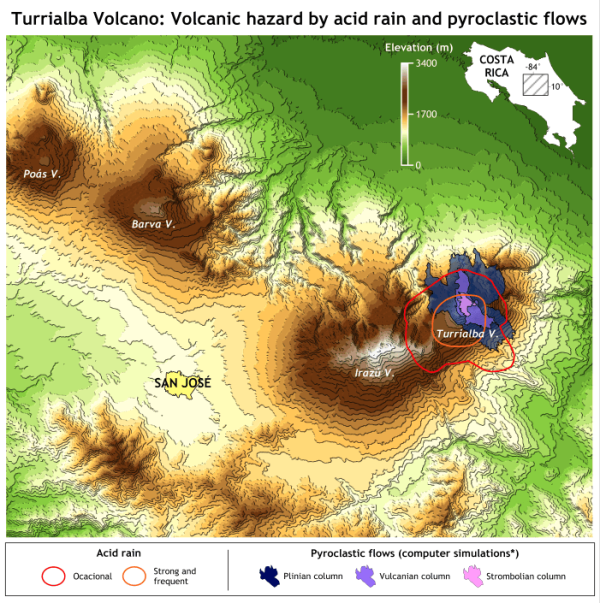
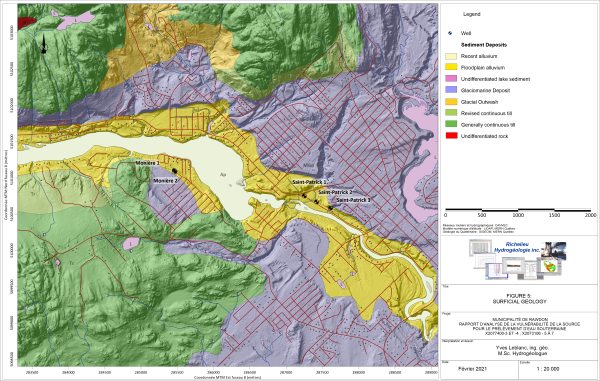
Visualize grids using 10+ different map types such as contours or surfaces, and combine the data with other layers like aerial photographs, spot locations, drillhole data and LiDAR point clouds.
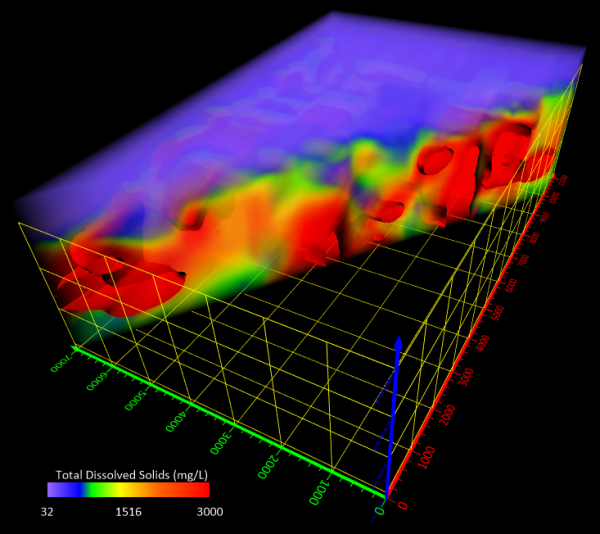
Level up your model with true 3D interpolation and many more unique features. Add point locations, surfaces, drillhole paths and data, and 3D XYZC grids as rendered volumes or isosurfaces in true 3D space.
In a fast-paced world, every moment counts. With Surfer’s lightning-fast capabilities, you can transform raw data into insightful maps in record time.
Say goodbye to tedious manual processes and hello to streamlined efficiency. Whether you’re mapping geological features, visualizing spatial trends, or presenting survey results, Surfer’s intuitive interface and powerful tools empower you to produce high-quality maps with unmatched speed.
Experience the thrill of effortlessly generating visually stunning maps that captivate your audience and convey your message with clarity. With Surfer, you’re not just creating maps—you’re shaping narratives and making impactful decisions at unprecedented speeds.
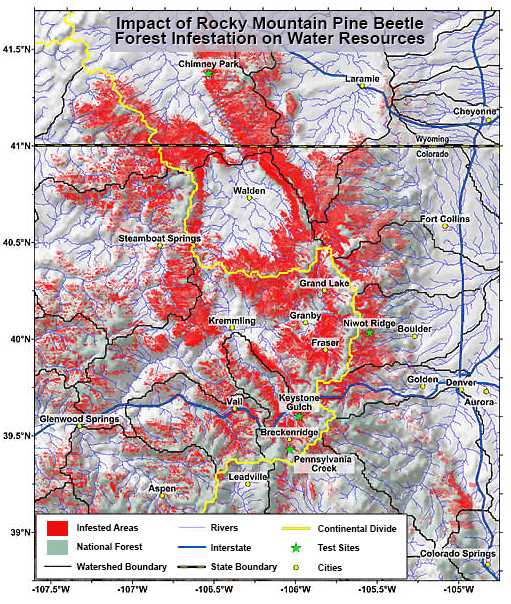
You’re driven to leverage your expertise to solve real-world problems, but communicating your solutions to both technical and non-technical audiences presents a challenge. Surfer bridges this gap, enabling you to develop a comprehensive understanding of your data and convey your discoveries to diverse audiences.
Add title blocks, company logos, legends, scale bars, cross sections, magnifiers, or multiple axes. Add context with imagery that’s imported or downloaded from online servers, including Google Maps, directly within Surfer.
Copy and paste directly into PowerPoint or Word, export map layers to DXF or DWG for AutoCAD, provide the field crew with a KMZ file to view the model in Google Earth, or export to PDF, 3D PDF, or TIF for your final report.
Help investors fully conceptualize the extent of the project by walking them through the site in 3D all from the comfort of the boardroom. Highlight areas of interest, pinpoint the source of contamination, and clarify the full extent of the remediation efforts.
“While you may not always give clients the answer they like, with Surfer, you give them an answer that improves their understanding.”
Get buy-in from stakeholders with visuals that speak directly to their concerns. Our tools empower you to turn complex data into clear narratives and give you full control over the presentation of your results.
Take advantage of complete control over all gridding parameters, including options to incorporate anisotropy, faults, breaklines, and variogram models.
Import and export numerous file formats like SHP, DXF, DWG, PDF, GeoTIFF, and XLSX, georeference images, and effortlessly manage unreferenced data and data in different and multiple coordinate systems.
Incorporate old data into your model with Surfer’s georeferencing and digitizing tools and the option to generate grid or raster files directly from contour maps.
Surfer is engineered for compatibility and high-performance computing.
| Gridding Methods | Kriging, Inverse Distance, Minimum Curvature, Polynomial Regression, Radial Basis Function, Triangulation, Nearest Neighbor, and more. |
|---|---|
| Import Formats | XLSX, CSV, TXT, SHP, DXF, DWG, GeoTIFF, LiDAR (LAS/LAZ), NetCDF, HDF, SRTM, and 50+ more. |
| Export Formats | 3D PDF, DXF, DWG, SHP, KMZ, GeoTIFF, PNG, JPG, SVG, and high-res vector formats. |
| Operating Systems | Windows 10, 11 (64-bit) |
Explore real-world models and maps generated by Surfer across various industries.