Emergency Release Dense Gas Model
This software provides a graphical user interface for the SLAB atmospheric dispersion model,
specifically designed for denser-than-air releases. It is an essential tool for predicting hazardous
zones and assessing potential impacts of accidental emissions.
The platform visualizes how a release evolves over time and determines the total footprint of the
incident.
Users can simulate continuous, finite duration, and instantaneous releases from four different
source types:
The SLAB model was developed in the 1980's by the Lawrence Livermore National Laboratory (LLNL), with financial support from the Department of Energy (DOE). The SLAB model is currently distributed by the U.S. EPA.
Learn MoreFully integrated GIS-based interface combining easy to use graphical tools.
Visualize plume dispersion in 3D with SLAB 3D's animation, ideal for presentations and analysis.
Export your buildings, sources, receptors and contours into Google Earth.
The SLAB model was developed in the 1980's by the Lawrence Livermore National Laboratory (LLNL), with financial support from the Department of Energy (DOE). The SLAB model is currently distributed by the US EPA.
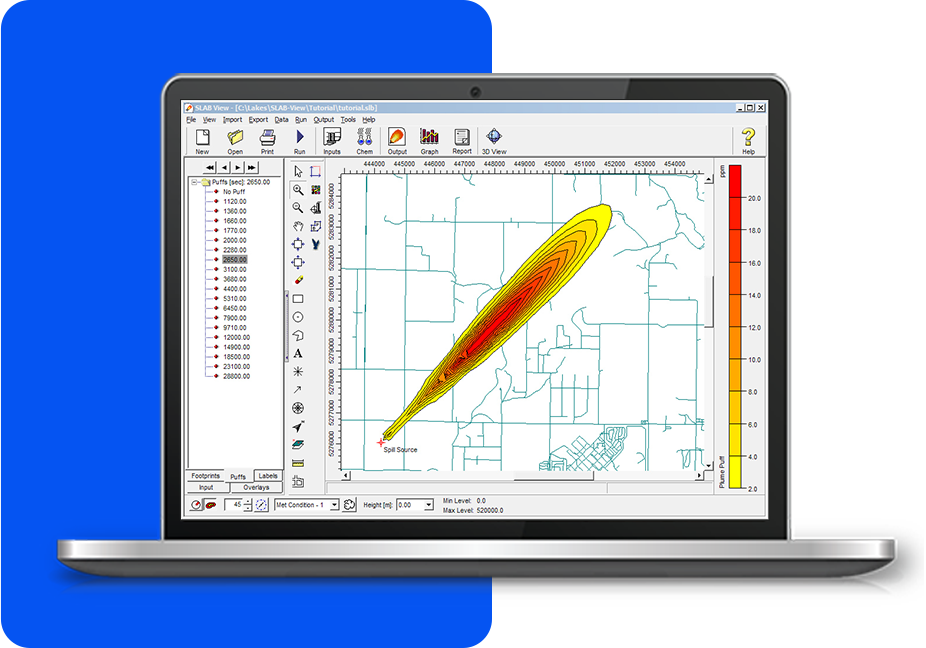
A fully integrated interface for atmospheric dispersion modeling. It combines user-friendly graphical tools with streamlined model execution for a smooth workflow. The software automates contouring and displays results effortlessly. This integration makes it easy to visualize and analyze model outcomes effectively.
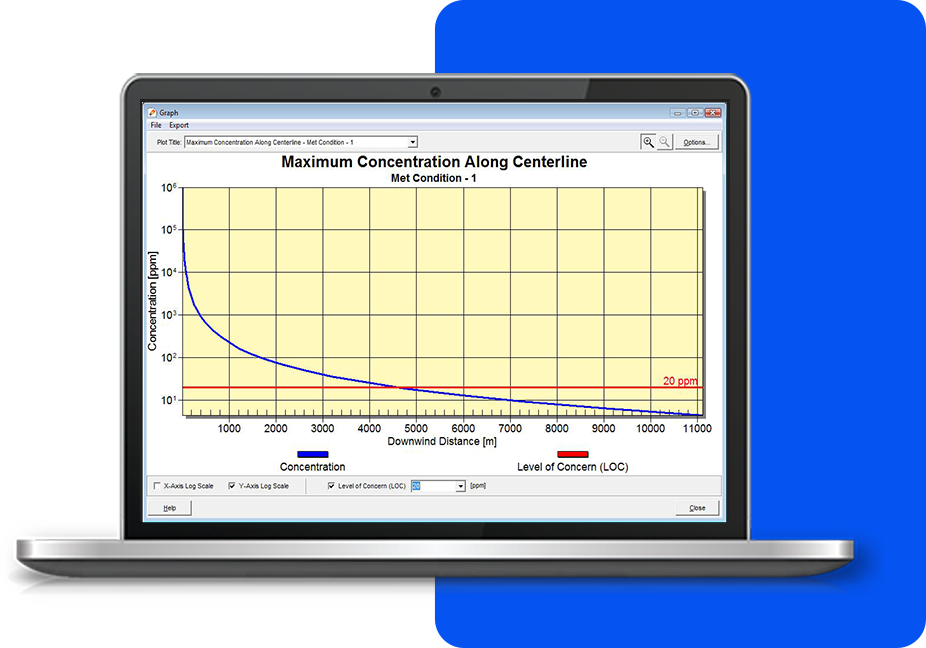
SLAB View automatically generates graphs displaying the Maximum Concentration Along the Centerline for all the meteorological conditions being modeled. You can specify the Level of Concern (LOC) for the chemical being modeled to be shown in the graph (indicated in this image as a red line).


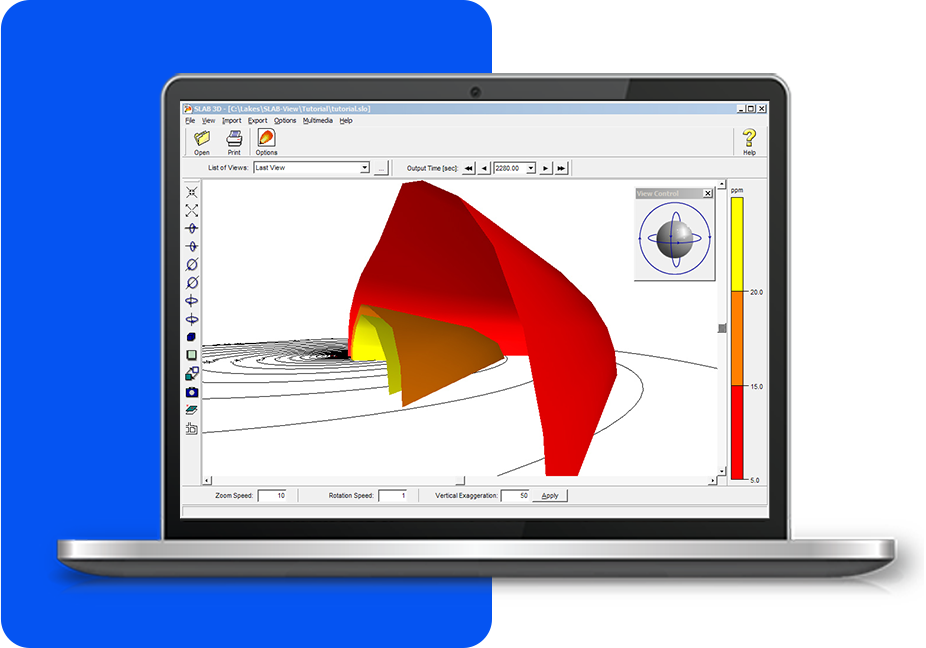
Allows you to observe plume dispersion in three dimensions. This feature makes it simpler than ever to understand the spread of a release. SLAB 3D also enables you to create animated representations of plume movement. These animations can be easily integrated into most presentation software for enhanced communication.
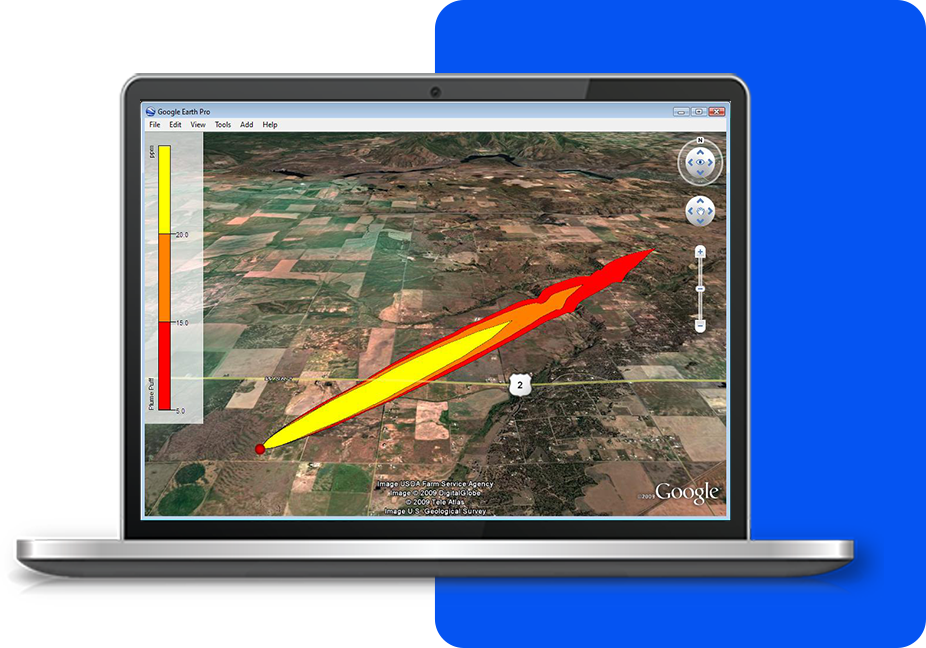
This powerful feature enables you to export the spill footprint or puff directly into Google Earth. This feature provides a more realistic view of the spill’s impact area. By visualizing the affected zone in Google Earth, it’s easier to understand the spill's reach. This enables better assessment of potential impacts on nearby regions.

SLAB View offers more than just an intuitive interface. Every copy comes fully equipped with all the tools you need to complete your project - no need for expensive add-ons.
Support for a variety of image and base map formats allowing you to setup your model with easy visualization and identification of the location of your spill area.
SLAB View has an extensive database of chemicals that can be modeled, including their properties. User defined chemicals can also be added.
SLAB View models several different release types such as horizontal and vertical jet, evaporation pool, and instantaneous or short duration evaporation pool.
SLAB View is an interface for the SLAB model. See below the technical specifications for this model.
Leverage our expertise for your most complex environmental challenges.
High-quality data processing for AERMOD/CALPUFF for any location worldwide.
Large-scale projects executed on our supercomputing clusters for rapid delivery.
Extensive hands-on instruction and research-based modeling training programs.
Advanced custom technologies to deliver unique solutions to complex global challenges.