Authorized Golden Software Reseller

Grapher

Grapher empowers engineers and scientists streamline their data visualization to clearly communicate complex datasets to a range of audiences with unparalleled speed and accuracy.
Grapher Interface Visualization
70+ Graph Types Publication Quality Full Automation Statistical Analysis Seamless Integration 3D Visualization 70+ Graph Types Publication Quality Full Automation Statistical Analysis

Visualize Complex Data with Ease

Making sense of complex datasets can be a challenge. Grapher meets this challenge head-on, offering an intuitive platform for creating stunning graphical representations. With Grapher, you have the power to simplify complex datasets, making them accessible and understandable.

Whether you’re generating plots for an industry presentation, updating quarterly reports for a client’s decommission project, or analyzing the environmental impact over time, Grapher not only conveys complex information clearly, it helps you do it with accuracy and elegance. Your expertise deserves nothing less than the best in visualization.

Dynamic Visualization

Effortlessly transform raw data into over 70 versatile graph types. From basic line and bar charts to complex 3D vectors and statistical plots, Grapher provides the flexibility to visualize data in any form you can imagine.

Complete Compatibility

Seamlessly visualize and analyze data from multiple sources. Import file formats like ACCDB, DBF, and XLSX, and export to popular formats like PDF, TIF, and PNG.

Impactful Presentations

Create visuals that not only convey data but tell a story. Utilize Grapher’s extensive customization to craft graphs that captivate your audience and highlight key insights.

Integrated Analysis Tools

Make informed decisions by discovering trends and opportunities hiding in data. Apply custom or pre-defined fit curves, error bars, or compute statistics on the raw data for a thorough understanding.

Clear Communication

Clearly Communicate Results to All Audiences. Grapher bridges the gap between data and decision-makers, enabling you to present findings that resonate with both technical and non-technical audiences.

Global Standards

Trusted by thousands of users across more than 100 countries, delivering robust tools and efficient workflows that empower professionals worldwide.

Extensive Graph Library

Grapher offers a massive library of 2D and 3D graph types to suit any scientific or engineering requirement.

Standard Basic Plots

Basic 2D Plots

Line, Scatter, Bar, Bubble, and Step plots. Ideal for everyday data representation with high precision.

Advanced Specialized Plots

Specialized Plots

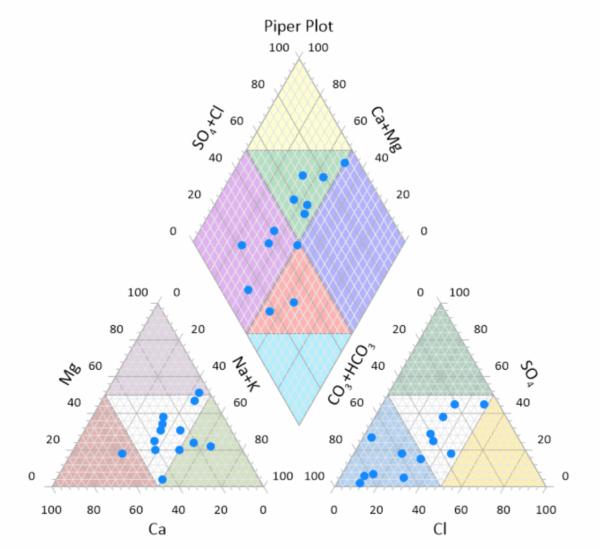
Ternary, Piper, Durov, Stiff, and Polar plots. Specialized tools for geology, hydrology, and chemistry.

Analytics Statistical Plots

Statistical Plots

Box-and-whisker, Histograms, Q-Q plots, and Pie charts. Perform deep statistical analysis visually.

3D Depth 3D Plots

3D & Contour Plots

3D Surface, Ribbon, Waterfall, and Vector plots. Visualize your data with a third dimension of depth.

Automate Tedious Workflows, Maximize Your Impact

Data visualization often involves tedious processes that can bog down even the most seasoned professionals. Grapher empowers you with cutting-edge tools that streamline the painstaking aspects of data visualization, allowing you to focus on more complex, creative, and impactful endeavors.

Streamlined Workflows

Transform raw data into compelling visuals with just a few clicks. Effortlessly navigate Grapher’s user interface and generate templates for repeated use.

Automation

Eliminate human error and time consuming clicks. Use the built-in script recorder or write your own scripts to automate repetitive tasks.

Graph Wizard

Ensure adherence to best practices at every stage with the Graph Wizard. Providing a guiding hand to both novice and experts alike.

Get Inspired

Explore the graph gallery to determine the most appropriate plot type for your data or discover new ways to represent your datasets.

Who Benefits from Grapher?

Grapher is used by professionals across a wide range of technical and scientific disciplines.

Scientists

Geologists, hydrologists, and environmental scientists use Grapher to analyze and present field data with precision.

Engineers

Civil, mechanical, and electrical engineers rely on Grapher's customization to meet strict design and reporting standards.

Researchers

Academic professionals use Grapher to create publication-ready charts for peer-reviewed journals and international conferences.

Technical Details

Engineered for performance and broad compatibility.

Manufacturer: Golden Software, LLC
Platform: Windows 10, 11 (64-bit recommended)
Memory (RAM): 1 GB minimum (2 GB recommended)
Hard Disk Space: 1 GB free space
Display: 1024 x 768 minimum resolution
Automation: Visual Basic compatibility (Scripter™)
Import Formats: XLSX, CSV, ACCDB, DBF, TXT, DAT, SQL, etc.
Export Formats: PDF, TIF, PNG, SVG, BMP, JPG, EPS, DXF, etc.
Languages: English

Ready to Visualize Your Data?

Join thousands of engineers and scientists who trust Grapher for their most critical data visualization needs.

Request a Quote Contact Sales